ThirdPartyLibrary
numba
安装
conda ...
conda install numba
pip ...
pip install numba
使用清单
函数是否完全支持numba加速(如:numba不支持np.reshape,np.max只支持first argument,np.linalg.norm只支持前两个argument)
数据类型是否已显式指出或者能根据上下文infer出来
easydict
用dot的方式取字典值
from easydict import EasyDict
... = EasyDict(<字典>)
安装
pip3 install esaydict
IO
colorama
彩色print
from colorama import Fore, Back, Style
print(Fore.RED + 'some red text')
print(Back.GREEN + 'and with a green background')
print(Style.DIM + 'and in dim text')
print(Style.RESET_ALL)
print('back to normal now')
print
print("\033[1;36m 字体颜色:青色\033[0m")

# 消除之前的print格式化操作对现在的影响\033[
# 消除当前的print格式化操作对后面的影响\033[0m
# 1; 字体加粗
# 36m 颜色配置

# print只输出一行
print("...",end='\r')  # \r为跳转到首行
glob
内置库
import glob
glob.glob(<含通配符的文件夹路径>)
# 绝对路径
print(glob.glob('/home/*.rviz'))
# return: ['/home/detection.rviz', '/home/default.rviz']
# 相对路径
print(glob.glob('*.rviz'))
# return: ['detection.rviz', 'default.rviz']
numpy
<np对象>.tofile(<文件名(str)>)将数组的数据以二进制的格式写入文件(需要指定数据类型和数据形状),不保存数组形状和数据类型np.fromfile()将其读回时需要指定数据类型,并按需进行形状上的修改
# 从kitti bin文件中读取点云的坐标值
np.fromfile(<文件名(str)>, dtype=np.float32).reshape(-1,4)[:,0:3]
np.loadtxt()读取txt文件
# 从modelnetv40的txt文件中读取点云的坐标数据
np.loadtxt(<文件名(str)>, delimiter=',', dtype=np.float32)[:,0:3]
np.savetxt() 将列表或numpy数组导出为txt文件
np.savetxt(<文件名(str)>, <需要保存的数据>, fmt='%06u')
其中fmt中表示对输出数据的格式化,补0操作仅适用于数值型数据,经实测,"%06s"时不会进行补0操作
os
内置库
import os
# 返回指定路径下的文件或文件夹列表
dirs = os.listdir(<某个路径名(str)>)
# 路径拼接
os.path.join(<某个路径名(str)>, <某个路径名(str)>)
# 返回某个文件的base name
os.path.basename(filename)
# 分离拓展名和文件名
os.path.splitext(filename)
shutil
需要相关的文件夹已经创建,否则会显示"no such file or directory"
import shutil
# 拷贝文件
shutil.copy(src=..., dst=...)
# 剪切文件
shutil.move(src=..., dst=...)
内置语法
with open(<文件名(str)>,'r') as f:
  f.readlines()        # 一次性读取全部(返回的是列表)
  (or) for line in f:  # 迭代地读取
备注
从bin文件中进行读取更省时间,从txt读点云(10000,6) 需要80ms,从bin读点云需要4ms
IO模块总结
module |
return object type |
|
|---|---|---|
pickle(外置库) |
python object |
二进制数据存储 .pkl |
numpy(外置库) |
ndarray object |
|
yaml(外置库pyyaml) |
python object(dict) |
.yaml |
都需要open出一个IO object才能 load / dump
import pickle
with open(<文件名(str)>, 'wb') as f:
  pickle.dump(object:f)

with open(<文件名(str)>, 'rb') as f:
  infos = pickle.load(object:f)
import numpy as np
with open(<文件名(str)>, 'wb') as f:
  np.tofile(object:f)

with open(<文件名(str)>, 'rb') as f:
  infos = np.fromfile(object:f)
import yaml
with open('<文件名(str)>', 'r') as f:  # 可使用相对路径
    yaml_config = yaml.load(f, Loader=yaml.FullLoader)
matplotlib
component
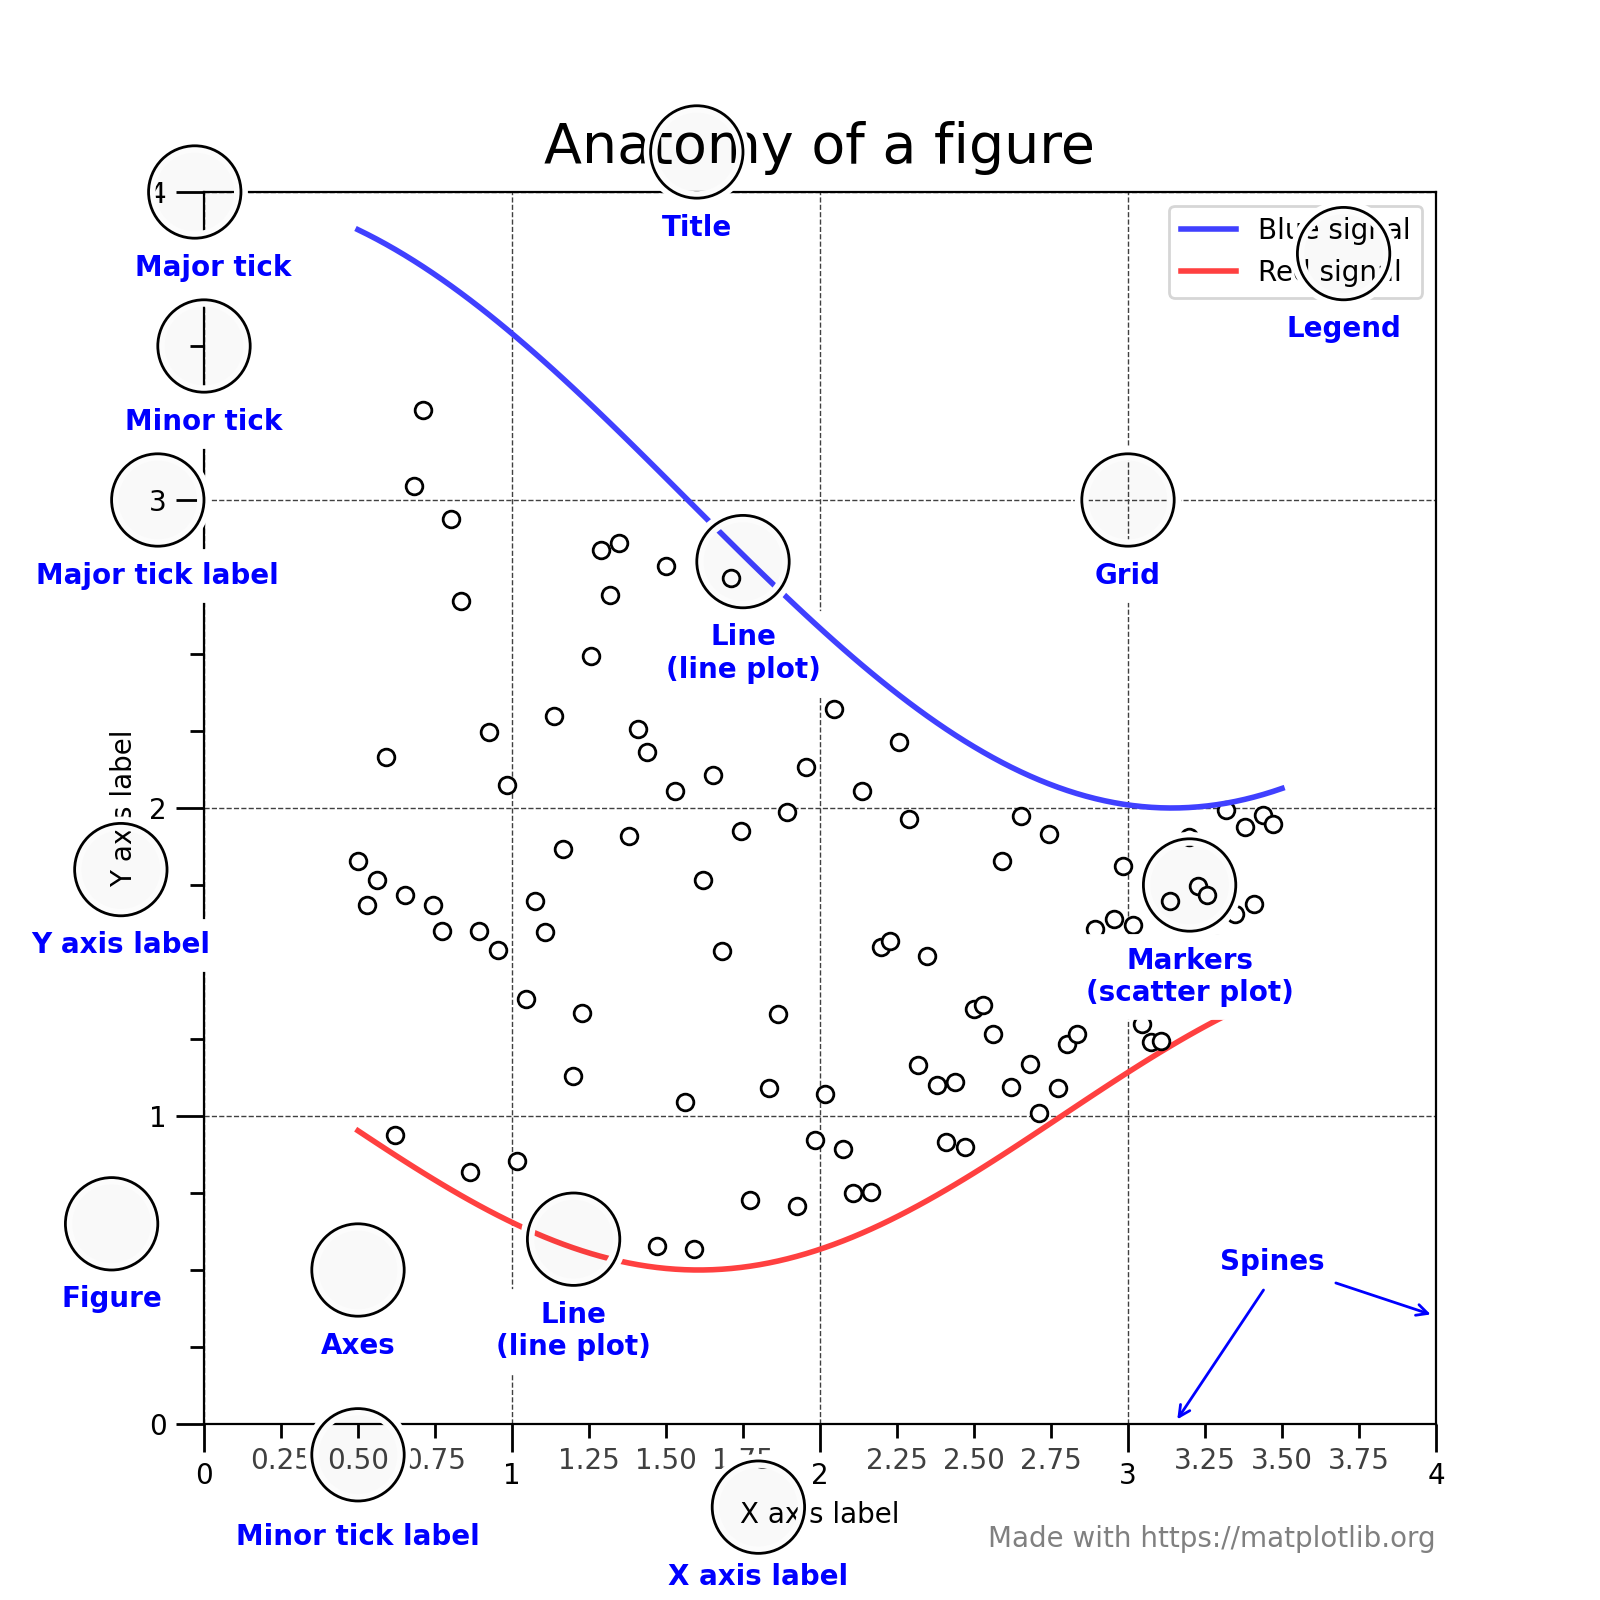
matplotlib在figure中绘图,创建figure的几种方法:
fig = plt.figure()  # an empty figure with no Axes
fig, ax = plt.subplots()  # a figure with a single Axes
fig, axs = plt.subplots(2, 2)  # a figure with a 2x2 grid of Axes
备注
An Axes is an Artist attached to a Figure that contains a region for plotting data, and usually includes two (or three in the case of 3D) Axis objects (be aware of the difference between Axes and Axis)
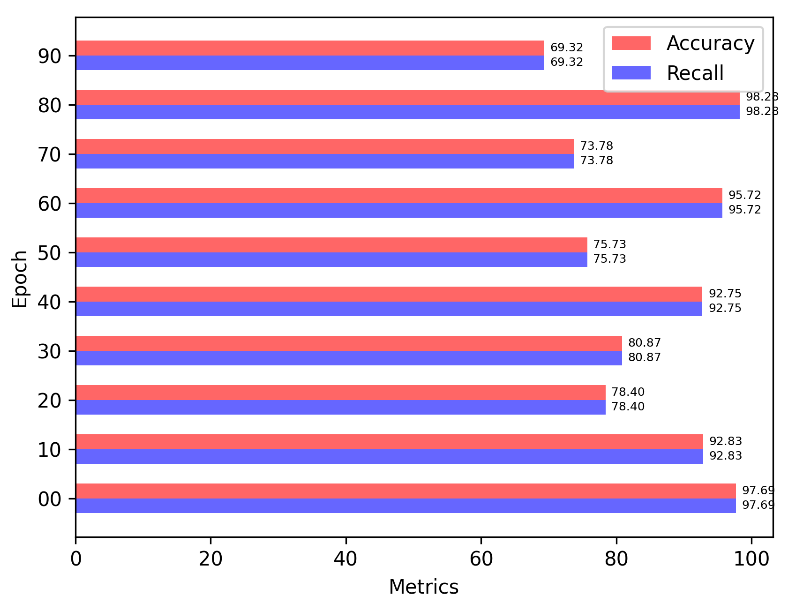
实例
给bar添加label
构建条形图
import matplotlib.pyplot as plt
import numpy as np
import matplotlib

fig, ax = plt.subplots(dpi=300)

labels = ["00", "10", "20", "30", "40", "50", "60", "70", "80", "90"]

X = np.random.uniform(60, 100, 10)
Y = np.arange(len(labels))  # the label locations

# barh
bar_height = 0.3
acc = ax.barh(Y + bar_height / 2, X, color="red", label='Accuracy', height=bar_height, alpha=0.6)
recall = ax.barh(Y - bar_height / 2, X, color="blue", label='Recall', height=bar_height, alpha=0.6)

# axis label
ax.set_xlabel('Metrics')
ax.set_ylabel('Epoch')

ax.set_yticks(ticks=Y, labels=labels)

bar_padding = 3
ax.bar_label(acc, fmt='%.2f', fontsize=6, padding=bar_padding)
ax.bar_label(recall, fmt='%.2f', fontsize=6, padding=bar_padding)

# legend(放置于右上方)
ax.legend(loc='upper right')
plt.show()
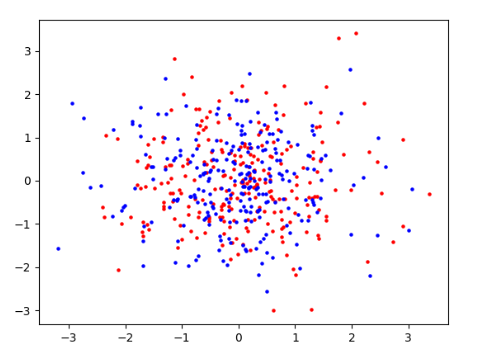
可视化散点图
from sklearn.decomposition import PCA
import numpy as np
import matplotlib.pyplot as plt

sample = np.random.randn(500, 4)
colors = np.array(['blue', 'red'])
proj_xy = PCA(n_components=2).fit_transform(sample)  # (N * 3, 2)
plt.scatter(proj_xy[:250, 0], proj_xy[:250, 1], s=5, color="red")
plt.scatter(proj_xy[250:, 0], proj_xy[250:, 1], s=5, color="blue")

plt.show()
multithreading
前者是操作系统对线程的标识号,后者是python的标识号
concurrent
import concurrent.futures as futures


def func(idx):
    return idx


num_worker = 4
datas = [1, 2, 3, 4, 5, 6, 7, 8, 9, 10]
with futures.ThreadPoolExecutor(num_worker) as executor:
    infos = executor.map(func, datas)

print(list(infos))  # [1, 2, 3, 4, 5, 6, 7, 8, 9, 10]
numpy
向量操作
vector product
a = [1, 2, 3]
b = [2, 3, 4]
c = np.dot(a, b) # 14
c = a.dot(b)
matrix multiplication
a = np.array([1, 2, 3])
b = np.array([2, 2, 2]).T
c = np.matmul(a, b)
c = a.matmul(b)
c = a @ b
备注
不会严格地执行矩阵相乘,np会根据输入进行调整
e.g:有关广播机制
# 预期:
| 1 2 |                     | 1*1  2*1 |
| 3 4 |  @  | 1 2 3 4 |  =  | 3*2  4*2 |
| 5 6 |                     | 5*3  6*3 |
| 7 8 |                     | 7*4  8*4 |

# 则需要先进行reshape操作:
reshape使广播机制成立,然后在向量广播操作后,可以使用hadamard积(element-wise)
广播操作:
                               | 1  1|
| 1 2 3 4 |.reshape(-1,1)  ->  | 2  2|
                               | 3  3|
                               | 4  4|
备注
广播操作需满足从最后一维开始,至少有一个维度的维数相同或者为1或者为0(scalar)
hadamard product (i.e element-wise product)
a = [[1,1],[2,2]]
b = [[2,3],[3,2]]
c = a * b  # [[2,3],[6,4]]
cross: 向量叉乘
np.cross(A, B)
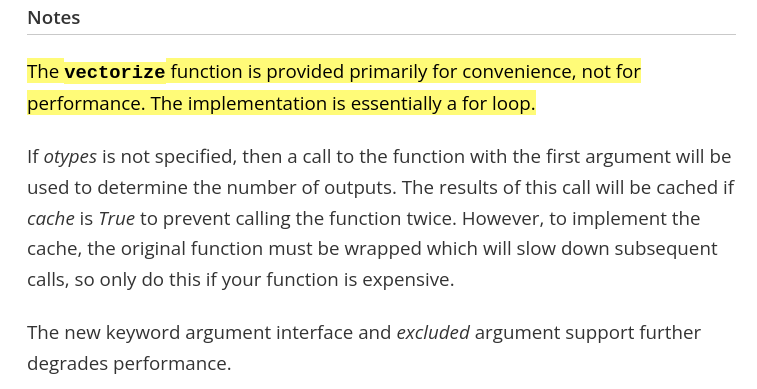
向量化操作
其向量化操作并不能提高速度,只是提高易用性
矩阵运算
求逆
# 求逆
np.linalg.inv(<矩阵>)
# 另一种形式为:np.matrix(<2D array>).I
# 求行列式
np.linalg.det()
# 解方程
np.linalg.solve(a<np.matrix>, b)
计算协方差矩阵
# (m,n) 共有n个数据,每个数据包含m个属性
# Each row of m represents a variable, and each column a single observation of all those variables. Also see rowvar below.
x1 = np.array([[1, 1, 2, 4, 2], [1, 3, 3, 4, 4]])
y1 = np.cov(x1, bias=True) # [[1.2 0.8], [0.8 1.2]]
注意
默认使用的是无偏估计(bias=False即/(n-1))
创建矩阵
零矩阵
# 传shape(tuple)
np.zeros((448,224,30))
# 初始化代价矩阵
iou_matrix = np.zeros((len(detections), len(trackers)), dtype=np.float32)
对角阵
# 自定义对角元
np.diag((2,3)) # [[2,0],[0,3]]
# 单位阵(方阵)
np.identity(2) # [[1,0],[0,1]]
# 非方阵
np.eye()
flatten
# Return a flattened copy of the matrix.
# All N elements of the matrix are placed into a single row. 保持原来维度
m = np.matrix([[1,2], [3,4]])
m.flatten()  # matrix([[1, 2, 3, 4]])

# 返回一维
m = np.matrix([[1,2], [3,4]])
np.ravel(m) # [1, 2, 3, 4]]
结构体
import numpy as np

structure = np.zeros(3, dtype=[("colour", (np.uint8, 3)), ("label", np.bool)])

structure[0]["colour"] = [0, 218, 130]
structure[0]["label"] = True
structure[1]["colour"] = [245, 59, 255]
structure[1]["label"] = True
数据堆叠
np.stack(list)

# 水平方向的堆叠
extrinsic_matrix = np.hstack([rotation_m, tvec])
# 垂直方向的堆叠
extrinsic_matrix = np.vstack([extrinsic_matrix, [0, 0, 0, 1]])
一维数组的堆叠
np.column_stack(
np.row_stack((
索引
切片索引
# 表示索引倒数第一行第一列的数据
Mat(-1,0)
ATTENTION
在numpy中进行
切片索引时,应使用单括号和多逗号,不能用多括号
mask[1:2][3:4]  ×
mask[1:2, 3:4]  √
而索引单个元素时,则效果一致,没有区别e.g. array [0][1] == array[0,1]
np一维数组shape的表示为(N,)(含逗号)
arr = np.array([1, 3, 4, 5, 7])
>>> arr[1:-1] # 3, 4, 5(不包含7)
布尔索引
适用于构建mask,来对数据进行筛查
mask = (temp > 0) & (temp < 89.6) & \
       (temp > -22.4) & (temp < 22.4)
pointcloud = pointcloud[mask]
函数
符号函数
# -1 if x<0
# 0  if x=0
# 1  if x>0
np.sign()
逻辑运算
# 按位与/或
np.bitwise_or(<bool_np_arrayA>, <bool_np_array>)  # 等价于&
np.bitwise_and(<bool_np_arrayA>, <bool_np_array>) # 等价于|
类型转换
# only apply for scalar object
np.int/float()
# apply for numpy object (类型c++的static_cast)
().astype()

numA = np.float32(1)
numB = numA.view(np.uint32)
print(numB) # 1065353216(类似c++中的reinterpret_cast)
print(numA.astype(np.uint32)) # 1(类似c++中的static_cast)
属性
arr_np.flags.writeable # 读写权限
arr_np.flags.c_contiguous
arr_np.flags.fortran
arr_np.flags.f_contiguous
# The array owns the memory it uses or borrows it from another object. 是否是引用
arr_np.flags.owndata
拓维
# (3,3) -> (1000,3,3)
np.exapnd_(a,axis=0).repeat(1000,axis=0)
实战
numpy矩阵相乘运算cpu占用率大
进行矩阵运算时默认使用多线程进行运算,可以通过限制线程数来减少占用率(运算时间会提高)
os.environ["OMP_NUM_THREADS"] = "1"
import numpy as np
获取某个值的索引位置
np.argwhere(img == 255)
行向量变为列向量
# 方法一:
().reshape(-1,1)
# 方法二:
<np_array>[:, None]
# np.newaxis是None的alias
备注
对一维数组进行转置并不会生成(1,N)或(N,1)
Ellipsis 省略号
...是冒号':'的拓展,避免写多个:,如[:, :, 0]等价于[..., 0];索引时只能存在一个
numpy for matlab
分块矩阵的合并
import numpy as np
matA = np.arange(0, 12).reshape(3, 4)
mat = np.block([[matA, matA], [matA, matA]])
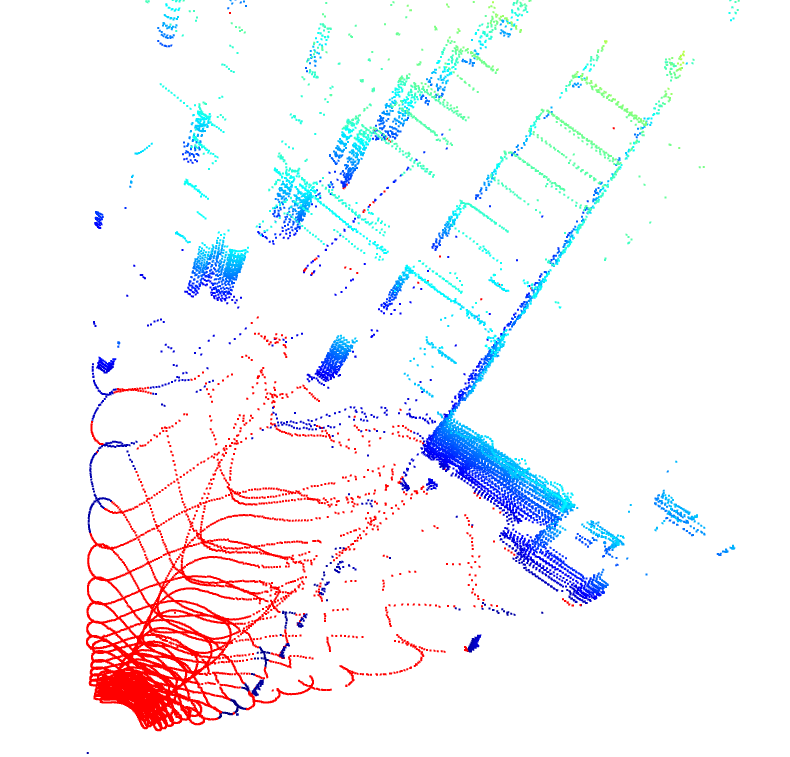
open3D
点云实例化
# np -> o3d object
point_cloud_o3d = o3d.geometry.PointCloud()
# append geometry(without intensity)
point_cloud_o3d.points = o3d.utility.Vector3dVector(pointcloud[:,:3])
注意
不能有强度信息(该接口现不支持)
去地面
import open3d as o3d

pcd = o3d.io.read_point_cloud("livox_pointcloud.pcd")
# 平面模型参数
plane_model, inliers = pcd.segment_plane(distance_threshold=0.05, ransac_n=3, num_iterations=1000)
inlier_cloud = pcd.select_by_index(inliers)
inlier_cloud.paint_uniform_color([1.0, 0, 0])
outlier_cloud = pcd.select_by_index(inliers, invert=True)
o3d.visualization.draw_geometries([inlier_cloud, outlier_cloud])
滤波
基于统计学滤波(剔除离群点)
pcd = o3d.io.read_point_cloud("livox_pointcloud.pcd")
filtered_pc, inliers = pcd.remove_statistical_outlier(nb_neighbors=20, std_ratio=2.0)
ML
安装
使用官方的指定的pytorch, cuda版本,否则要源码编译
git clone https://github.com/isl-org/Open3D-ML.git
cd Open3D-ML
pip install -r requirements-torch-cuda.txt
测试安装效果
python -c "import open3d.ml.torch as ml3d"
备注
其集成度较高,适用于训练和预测(不适合于**部署**)
VIS
(至2021.2.11)其可视化交互界面的文档暂时不是很全,上手比较麻烦
opencv
使用摄像头
example1
import cv2
capture = cv2.VideoCapture(0)

# VideoCaptureProperties
capture.set(3, 1280)  # 常用配置属性,宽
capture.set(4, 720)    # 高
capture.set(5, 30)      # 帧率
while (True):
    ret, frame = capture.read()
    cv2.imshow('frame', frame)
    # return the Unicode code point for a one-character string.
    if cv2.waitKey(1) == ord('q'):
        break
example2
camera_open_flag = False
while not camera_open_flag:
    try:
        cap = cv2.VideoCapture(0)
        # 配置显示图片的宽、高、帧率
        cap.set(3, 1280)
        cap.set(4, 720)
        cap.set(5, 8)
        if cap.isOpened:
            print('successfully open camara')
            camera_open_flag = True
    except:
        time.sleep(1)
        print('retry to open the camera')
两张图片的叠放
营造图层叠放效果
import cv2
# 加权系数、偏置项
add_img =  cv2.addWeighted(img_1, 0.7, img_2, 0.3, 0)
掩膜操作
判断点是否在某个多边形中
import cv2
# 轮廓点、测试点、是否返回距离(ture:表示该点在多边形中)
left_sign = cv2.pointPolygonTest(contour_, test_point, False)
# 其返回值是浮点型
图片读写和显示
# 读图片
img = cv2.imread(image_path)
# 显示图片
cv2.imshow("窗口名称", img)
# + 限定尺寸大小(W,H)
cv2.imshow('窗口名称', cv2.resize(img, dsize=(600, 320)))
视频流
生成视频流
for split, dataset in zip(splits, datasets):
    fourcc = cv2.VideoWriter_fourcc(*'MJPG') # 编码方式
    vout = cv2.VideoWriter(<"输出的文件名">, fourcc , 30.0, (img_w, img_h))
    for i, data in enumerate(tqdm.tqdm(loader)):
        ...
        vis = cv2.imread(os.path.join(cfg.data_root,names[0]))
        vout.write(vis)

    vout.release()
窗口
# 定义窗口名称
cv2.namedWindow("窗口名称")
cv2.destroyAllWindows()
通道转换
# 颜色通道/空间变换
cv2.cvtColor(img, cv2.COLOR_BGR2GRAY)
按键
key = cv2.waitKey(1)
if key & 0xFF == ord('q'):
    break
标定
去畸变
distortion = np.loadtxt("畸变系数txt文件")
intrinsic_matrix = np.loadtxt("内参矩阵")
# 消除图像distortion
img = cv2.undistort(img, intrinsic_matrix, distortion)
添加元素
加圆
给定中心位置和半径画实心或空心圆
photo = cv2.imread('<图形路径>')
cv2.circle(photo, center=(500, 400), radius=100, color=(0, 0, 255), thickness=2)

# 可视化2D的投影点云
for (x, y), c in zip(pts_2d, color):
    # 图片,圆心位置位置,圆半径,圆颜色,边界厚度(-1:填充)
    cv2.circle(img, (x, y), 1, [c[2], c[1], c[0]], -1)
交互操作
# ret: tuple(four element)
ROI = cv2.selectROIs(img, fromCenter=False, showCrosshair=True)

colormap
import cv2
im = cv2.imread('test.jpg', cv2.IMREAD_GRAYSCALE)
imC = cv2.applyColorMap(im, cv2.COLORMAP_JET)
图形化
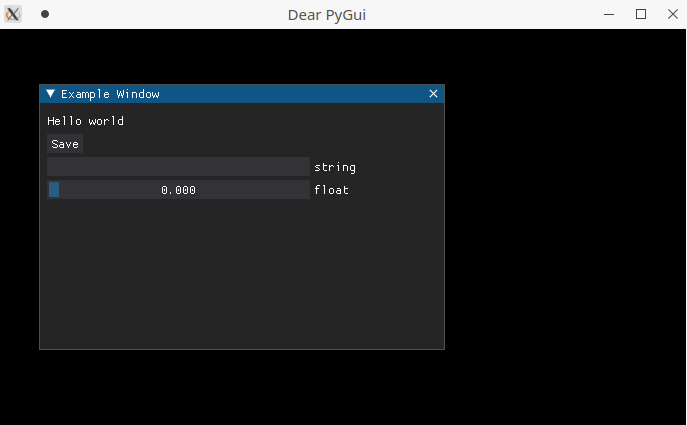
pygui
备注
暂无排上用场
创建一个窗口
添加按钮
添加文本
def save_callback():
    print("Save Clicked")

with dpg.window(label="Example Window"):
    dpg.add_text("Hello world")
    dpg.add_button(label="Save", callback=save_callback)
    dpg.add_input_text(label="string")
    dpg.add_slider_float(label="float")
添加菜单栏
包括子窗口菜单栏和主窗口菜单栏
Glossary
alias - A string that takes the place of the regular int ID. Aliases can be used anywhere UUID’s can be used.
item - Everything in Dear PyGui created with a context manager or a add_ command.
root - An item which has no parent (i.e. window, registries, etc.)
window - A Dear ImGui window created with add_window(…).
viewport - The operating system window.
tag:组件的ID / alias
packing
pyinstaller
pip install pyinstaller
for windows
pyinstaller -F -c .\<file_-name>
option:
-F/-D:将所有依赖打包成一个文件/非一个文件
-c(default)/-w:是否需要控制台/终端来显示标准输入和输出
NOTE
如果打包成一个文件的话,到时运行时需要解压操作,所以打开时较慢.
实测,不能打包文件和资源文件夹同名
auto_py_to_exe
pyinstaller的GUI版本
nuitka
安装 (for windows)
备注
实测只能使用**纯python环境**,否则会有如下报错:FATAL: Error, usable static libpython is not found for this Python installation. You might be missing required '-dev' packages. Disable with --static-libpython=no" if you don't want to install it.
# 使用纯python环境时
$ pip install -U nuitka

# 使用conda环境时
$ conda install -c conda-forge nuitka
NOTE
nuitka推荐教程
pathlib
备注
支持跨系统使用,解析路径友好;一般会用该模块,来取代 os 模块的功能;其支持sorted()方法;一些module比如 open3d 不支持 PosixPath 类,传参时需要转化为 str 型;在Path对象中可使用 .. 等进行拼接,后续调用 resolve() 方法进行解析
常用代码块
# 01.导入库
from pathlib import Path

# 02.判断文件或文件夹是否存在
<Path object>.exists():

# 03.将相对路径转换为绝对路径(resolving any symlinks)
p = Path()   # 默认使用的是当前路径

# 04.创建文件夹
# parents:若parent目录缺失,则会递归的创建;
# exist_ok:文件夹已存在时,不会报错也不会覆盖建文件夹
<Path object>.mkdir(parents=True, exist_ok=True)

# 05.通配符模式(列出通配符的文件)
# 返回的是generator,可以使用list()将其转换为列表
image_path = (Path('/home/helios/image/').glob('*.jpg'))

# 06.添加后缀
<Path object>.with_suffix('.jpg')
os |
Path |
description |
|---|---|---|
``os.path.isdir()` <https://docs.python.org/3.11/library/os.path.html#os.path.isdir>`_ |
``Path.is_dir()` <https://docs.python.org/3.11/library/pathlib.html#pathlib.Path.is_dir>`_ |
判断是否是文件夹 |
``os.path.isfile()` <https://docs.python.org/3.11/library/os.path.html#os.path.isfile>`_ |
``Path.is_file()` <https://docs.python.org/3.11/library/pathlib.html#pathlib.Path.is_file>`_ |
判断是否是文件 |
提示
一些常用属性,以"/home/helios/path.py"为例
其
name(即basename) 为path.py其
parent(即dirname) 为/home/helios其
stem为path(不带后缀的basename)
参考资料
命令行解析
argparse
关键词参数命令行解析
import argparse
# 步骤一:创解析器
parser = argparse.ArgumentParser(description="arg parser")

# 步骤二:添加参数
parser.add_argument('--cfg_file', type=str, default='cfgs/default.yml', help='specify the config for evaluation')

parser.add_argument('--eval_all', action='store_true', default=False, help='whether to evaluate all checkpoints')

parser.add_argument('--start_epoch', default=0, type=int, help='ignore the checkpoint smaller than this epoch')

parser.add_argument('--set', dest='set_cfgs', default=None, nargs=argparse.REMAINDER, help='set extra config keys if needed')

# --epochs E, -e E Number of epochs (添加用例m)
parser.add_argument('--epochs', '-e', metavar='E', type=int, default=5, help='Number of epochs')

# 步骤三:解析参数(return Namespace object)
args = parser.parse_args()

# 可以调用vars(args)得到字典object
位置参数命令行解释
import sys
sys.argv.__len__()
... = sys.argv[1]
# [0]一般对应的是文件名
fire
typer
主要用于开发命令行工具
pyttsx3
文本转语音
import pyttsx3

engine = pyttsx3.init()
# to fix bug: Full dictionary is not installed for 'zh'
# 使用普通话语音包
engine.setProperty('voice', 'zh')
# 设置语速
engine.setProperty('rate', 130)
pyttsx3.speak('测试')
scipy
计算凸包
import numpy as np
from scipy.spatial import ConvexHull
points = np.random.rand(10, 2) # 30 random points in 2-D
hull = ConvexHull(points)
import matplotlib.pyplot as plt
plt.plot(points[:,0], points[:,1], 'o')
for simplex in hull.simplices:
    plt.plot(points[simplex,0], points[simplex,1], 'k-')
plt.show()
进度条
tqdm
template
from tqdm import tqdm
from time import sleep

# 每次更新+100->总共为1000
# Epoch 1: description: 100%|██████████| 1000/1000 [00:01<00:00, 983.91img/s, acc=0.9, loss=0.1]
for epoch in range(10):
    with tqdm(total=1000, desc=f"Epoch {epoch}: description", unit="img") as pbar:
        for i in range(10):
            sleep(0.1)
            pbar.update(100)
            pbar.set_postfix(loss=0.1, acc=0.9)
trange
from tqdm import trange

# 等价于tq
for i in trange(100):
    sleep(0.01)
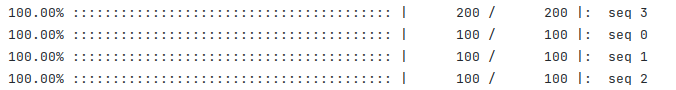
atpbar
多进程进度条
import multiprocessing
from time import sleep

from atpbar import atpbar, find_reporter, flush, register_reporter


def preprocess(seq):
    if seq > 2:
        for _ in atpbar(range(200), name=f"seq {seq}"):
            sleep(0.01)
    else:
        for _ in atpbar(range(100), name=f"seq {seq}"):
            sleep(0.1)


reporter = find_reporter()

process_num = 4
data = [0, 1, 2, 3]
with multiprocessing.Pool(process_num, register_reporter, [reporter]) as p:
    ret = p.map(preprocess, data)
    flush()
适用于标准终端:
读取数据(DL)
以下几种读取常规的图片时速度基本一样
matplotlib
from matplotlib import image
matplotlib_image = image.imread('<str 图片路径>')
opencv
读取后直接为np类型的数据,layout为(H,W,C),若是彩色图,则显色模式为(B,G,R)(三通道uint8);其可根据图像的类型自行调节是读取rgb还是灰度值。但推荐加入.convert使代码更具可读性
import cv2
cv2_image = cv2.imread(<str 图片路径>)
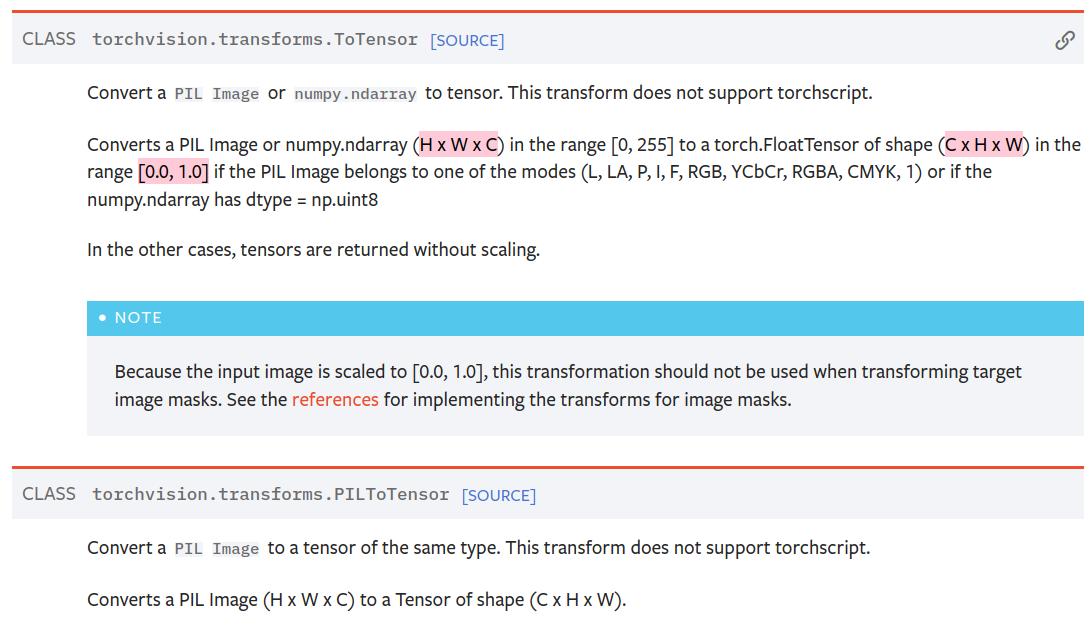
PIL
pytorch在读取数据时使用PIL较多
安装
pip install pillow
如果要显示图片的话需要安装imagemagick
sudo apt install imagemagick
rgb图读取后的layout为(W,H),转为numpy后的layout为(H,W,C),显色模式为rgb
from PIL import Image
import numpy as np
# 读取rgb时应该添加RGB否则会添加a通道
pil_image = np.asarray(Image.open(<str 图片路径>).convert('RGB'))
备注
读取后的图片在pytorch中不能直接使用而需要转换下通道(对应于transpose(2,0,1))。实际上在pytorch中使用transforms.Totensor时即完成了该步骤。
skimage
安装
pip install scikit-image
效果等同于opencv
from skimage import io
io_image = io.imread(<str 图片路径>)